- D3 Part 1 - SVG Shapes
- D3 Part 2- D3 + Angular 7 Integration
- D3 Part 3- D3 Data Bound to DOM Elements
- D3 Part 4- D3 Creating SVG Elements Based on Data
D3 SVG Coordinate Space
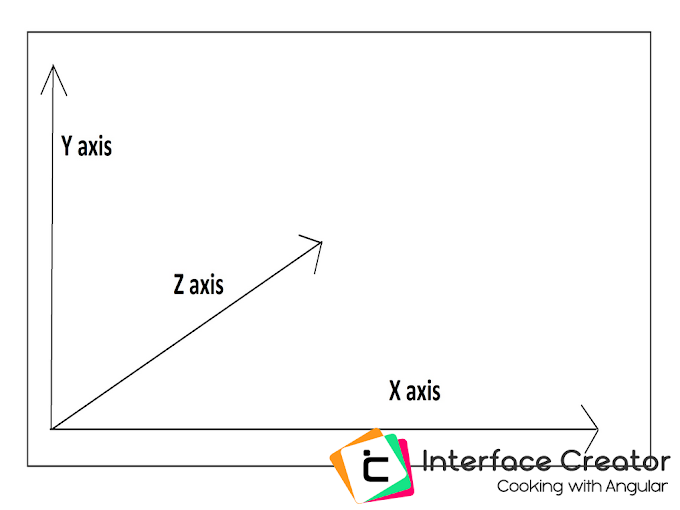
Like graph we can define the SVG elements coordinates.Using D3.js to add SVG elements to specific coordinates in a graph based on data.
let coordinatesDS= [50, 100, 150,200,250,300,350];
SVG Circle Element Coordinate Space without using D3 refer W3schools
cy: y-axis coordinate of the center of the circle.
without d3, how actually cx and cy works with svg let's see the below example
Code Action @StackBlitz
Coordinates Data-set
// Data set Created for circle elements radiouslet coordinatesDS= [50, 100, 150,200,250,300,350];
SVG Circle Element Coordinate Space without using D3 refer W3schools
Basic Coordinate Attributes are
cx: x-axis coordinate of the center of the circle.cy: y-axis coordinate of the center of the circle.
without d3, how actually cx and cy works with svg let's see the below example
// example code
<div id="circleelement" >
<svg height="200" width="200">
<circle cx="50" cy="50" r="25" stroke="yellow" stroke-width="5" />
<circle cx="100" cy="100" r="25" stroke="yellow" stroke-width="5" />
<circle cx="150" cy="150" r="25" stroke="yellow" stroke-width="5" />
</svg>
</div>
D3.js allows us to use a function in the "cx" and "cy" attributes.
// Div element selected from angular's Componentlet divcircleelementdatabound = d3.select('#circleelementdatabound');// svg element added inside the selected div element
let svgforcircleelements = divcircleelementdatabound.append('svg').attr('width', 500).attr('height', 500);// Data set Created for circle elements radious
let coordinatesDS= [50, 100, 150,200,250,300,350];
// Coordinate Space using D3 function
// D3.js allows us to use a function in the "cx" and "cy" attributes.
let circleelements = svgforcircleelements.selectAll('circle')
.data(coordinatesDS)
.enter()
.append('circle')
.attr('cx', function (d) { return d; })
.attr('cy', function (d) { return d; })
.attr('r',20 )
.attr('stroke','black')
.attr('stroke-width','2')
.style('fill', function (d) {
if ( d === 50) {
return 'red'
}else if (d=== 100) { return 'green'}
else if (d=== 150) { return 'blue'}
else if (d=== 200) { return 'yellow'}
else if (d=== 250) { return 'orange'}
else if (d=== 300) { return 'purple'}
else if (d=== 350) { return 'white'}
});
Output
Run the project And see the resultCode Action @StackBlitz


0 Comments